Writing x64dbg scripts
x64dbg is an open-source x64/x32 debugger for windows, it has dozens of features that make the life of reverse engineers and malware analysts easier.
One of the coolest features of x64dbg is that it’s extendable, it comes with a debuggable scripting language and a software development kit for writing your own plugins.
In this post we will talk about x64dbg scripting and in the next one we will talk about plugins.
Scripts are just a sequence of commands, you can see all the available commands here.
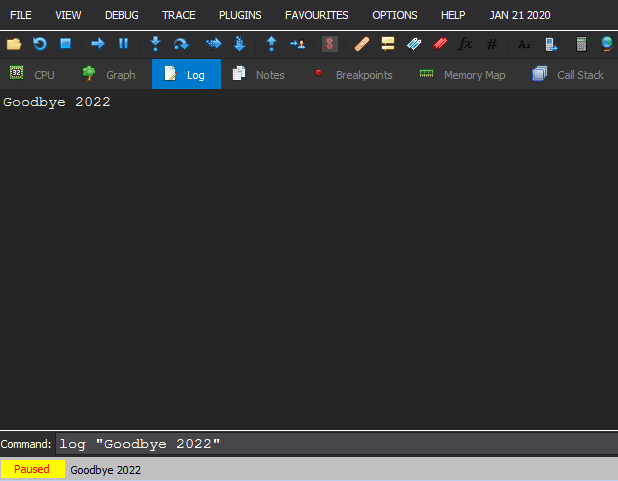
To execute a command you can simply type it in the command prompt and check the result in the Log window.
For this tutorial we will write a simple script to automatically dump unpacked PE payloads in memory.
The unpacking workflow (how I usually do it) is to set a breakpoint at VirtualAlloc and VirtualProtect, run the program and follow the memory allocations in dump waiting for the MZ header to appear then dump that memory region. Let’s use the power of scripting to automate this process.
First we will define two variables to hold the address and size of allocated memory regions using var command.
var mem_addr
var mem_size
Next we can set our breakpoints.
bp VirtualAlloc
SetBreakpointCommand VirtualAlloc, "scriptcmd call cb_virtual_alloc"

bp VirtualProtect
SetBreakpointCommand VirtualProtect, "scriptcmd call cb_virtual_protect"
We can use SetBreakpointCommand to set a command to execute when the breakpoint is hit.
The command we need here is call which will jump to a callback function defined by a label, we also have to use scriptcmd to execute the call in the context of a running script (not in the context of the debugging loop).
cb_virtual_alloc:
    rtr
    set mem_addr, cax
    log "Allocated memory address: {x:mem_addr}"
    set mem_size, arg.get(1)
    log "Allocated memory size: {x:mem_size}"
When we reach this callback we first need to use rtr command (run till return) to let VirtualAlloc does the memory allocation.
Next we can get the returned memory address stored at eax/rax and store that value in mem_addr variable.
x64dbg provides the following registers: cax , cbx , ccx , cdx , csp , cbp , csi , cdi , cip which are mapped to 32-bit registers on a 32-bit platform, and to 64-bit registers on a 64-bit platform. This gives you the ability to write architecture-independent code, so we will use cax to get the return value.
As all good developers know the best debugging technique is print-based debugging :)
So we can use the log command to print some logging messages.
The log command takes one argument which is a format string, you can read about the string formatter here. We only need the basic syntax which is {?:expression} where ? is the optional type of the expression (x for hex value).
Next we need to get the size of the allocated memory which is passed to VirtualAlloc as the second argument.
To get an argument at a given index we can use the expression function arg.get(index) which gets the argument at a given index (zero-based). Note that you should be inside the function boundaries to get the correct value.
With that done let’s define the next callback.
cb_virtual_protect:
    log "New protection: {x:arg.get(2)}"
    cmp word(mem_addr), 5a4d
    jne main
    savedata :memdump:, mem_addr, mem_size
First we log the third argument of VirtualProtect which is the new memory protection, this can be used to check for protection changes which might indicate unpacking but we won’t use it here.
Next we use another expression function word to read the first 2 bytes from the previously allocated memory address and compare them to 0x5a4d (the MZ header). Note that all numbers are interpreted as hex by default.
If the check is false we jump to the main label and continue execution, if not we save that memory region to disk.
The first argument of savedata command is the filename, if we use :memdump: as a name it will save the file as memdump_pid_addr_size.bin in the x64dbg directory.
Finally we use run command to run the program and watch the magic happen. you can use Tab to step into the script or Space to run the script.
Simple as that.
Full script:
// define a variable to hold allocated mem address
var mem_addr
// define a variable to hold allocated mem size
var mem_size

// set breakpoint on VirtualAlloc
bp VirtualAlloc
// set callback on breakpoint hit
SetBreakpointCommand VirtualAlloc, "scriptcmd call cb_virtual_alloc"
// set breakpoint on VirtualProtect
bp VirtualProtect
// set callback on breakpoint hit
SetBreakpointCommand VirtualProtect, "scriptcmd call cb_virtual_protect"

// go to main label
goto main

// define VirtualAlloc callback label
cb_virtual_alloc:
    // run until return (stepout)
    rtr
    // set mem_addr value to cax value (return value)
    set mem_addr, cax
    // log memory address
    log "Allocated memory address: {x:mem_addr}"
    // set mem_size value to VirtualAlloc's second arg value (region size)
    set mem_size, arg.get(1)
    // log memory size
    log "Allocated memory size: {x:mem_size}"
    // go to main label
    goto main

// define VirtualProtect callback label
cb_virtual_protect:
    // log VirtualProtect's second arg value (new protection)
    log "New protection: {x:arg.get(2)}"
    // compare the first 2 bytes at mem_addr address to "MZ"
    cmp word(mem_addr), 5a4d
    // if not equal, jump to main label
    jne main
    // dump data at mem_addr address to disk
    savedata :memdump:, mem_addr, mem_size

// define main label
main:
    // run the program
    run

// end the script
ret